

In this entry we try to find when a classification problem is imbalanced.
Data
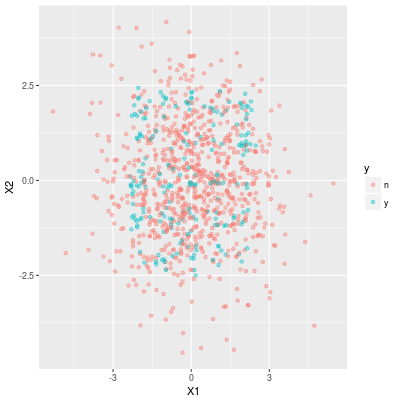
We use an artificially generated dataset which we used the entry #07-1 and we change the proportion of positive samples. (We temporary call the proportion the positive rate in this entry.)
The positive rate and the performance metrics
The problem of an imbalanced classification (or a skewed target variable) is that a trained model predicts that almost all samples are negative. This phenomenon can be regarded as a definition of an imbalanced classification. (So the skewness depends on both a dataset and a trained model.)
So we train models on datasets with different positive rates and compute performance metrics: y.rate (proportion of positively predicted samples), recall (or TP rate), precision and f1.score (F1-score).
Because of the pattern a logistic regression model (or elastic net model) is not able to make a good prediction, therefore we use only random forest, XGBoost and SVM.
- Fix p (=0.05, 0.10, 0.15, ..., 0.45)
- generate a training set and a test set
- train models: random forest, XGBoost and SVM
- compute the performance metrics
- do 2–4 ten times
- go to 1
- compute the average of the metrics
The line graph of the metrics is following:
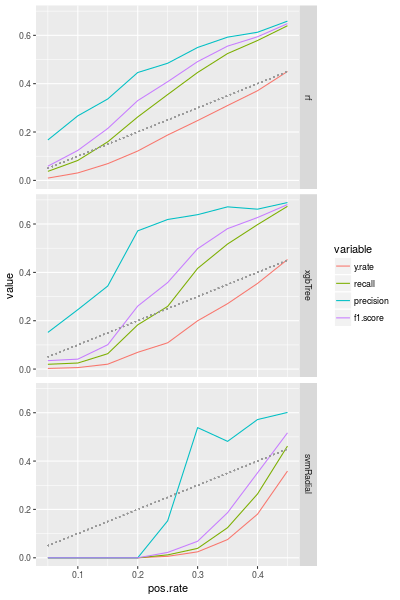
The gray dotted line is a diagonal line, so if y.rate is quite under the dotted line, then the model picks a relatively small number of samples as a positive samples. In other words, the classification problem is imbalanced.
For the random forest model and the XGBoost model we may say that the target variable is skewed if the positive rate is smaller than 0.3 (for the dataset). But the performance metrics for the SVM model are very bad even though the positive rate is 0.4.
Effect of regularization on the performance metrics
Why is the performance of a SVM model on an imbalanced classification so bad?
By algorithms the SVM tends to avoid overfitting while the random forest and the XGBoost focus on the high accuracy (on the training set), Thus we may guess that SVM works if the effect of regularization of SVM is small. This means that the cost parameter of SVM is large.
So we compute the average of performance metrics in a similar way to above and we also train random forest classifiers for comparison.
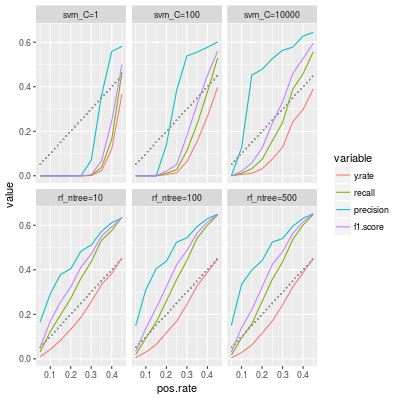
In the label svm_C=100 means cost=100. As our guess, a large cost improves the performance metrics. In particular the precision becomes clearly better. But the y.rate is still smaller than the positive rate even though p=0.3.
On the other hand the number of trees in a random forest classifier does not seem important for the performance metrics. (So we may choose a small number of trees to save time.)
Summary
- The skewness depends on a dataset and a model.
- For random forest the positive rate should be larger than 0.3 (for the dataset we used above).
- SVM requires a high positive rate (p=0.4, 0.45, 0.5).