

Feature engineering is manual creation of features (predictors). In the case of Titanic competition
- divide ticket prices into four classes (bins)
- define a new variable
FamilySizebySibSp+Parch
are examples of feature engineering. I recommend "Feature Engineering Tips for Data Scientists" for concrete examples and explanations of feature engineering.
Why I need feature engineering
In this entry I will explain some improvement of my recommender system. My training data looks as follows.
| docid | term1 | ... | term1000 | label |
| 1 | 1.327 | ... | 0 | 1 |
| 2 | 3.122 | ... | 2.333 | -1 |
| 3 | 0 | ... | 4.532 | 1 |
Each row corresponds a text and each text is converted into a vector through TFIDF, a variant of honest word counting. The variables term1, ... , term1000 gives the value of TFIDF corresponding to a (stemmed) word. label is the target variable taking ±1.
(cf. Recommender System without CF)
When creating a predictive model on this server, I have two problems to solve.
- No library for fast numerical computing such as numpy or PDL. This means that I need to implement algorithms for optimisation. Moreover the computation could be very slow.
- The memory which I can use is very limited. The cron job which creates a predictive model could be terminated, if the job tries to use more memory than the limit.
The second problem does not allow me to deal with the original training data with too many predictors. Therefore I have to reduce the number of predictors so that the computation will be executed without any problem.
An easy way to reduce the number of predictors is PCA. I implemented SDV for PCA (without any library for numerical computation), but the computation is very slow. For a certain large matrix, it takes longer than one hour to get SVD. This is obviously not practice.
For this reason I try the following ideas
- Remove stop words and apply Porters stemmer algorithms.
- Remove predictors whose values are 0 except one text (to avoid overfitting).
- Pick top 70 predictors of variance. (This is a degenerate idea of PCA.)
The first idea is very good to reduce the number of predictors without loss of information. The rest ideas are not so bad and I found a better solution to this problem, so I'd like to describe the idea.
How to choose good predictors
In this entry feature engineering means just a selection of predictors. One of the difficulties of my recommender system is that predictors are different each time. So I need to a criterion for selecting predictors.
The following table shows that the CV score (average of accuracy scores on validation sets).
| method | base | SVM | RF | KNN | wPLR | PLR | cos |
| all | 0.55 | 0.76 | 0.66 | 0.57 | 0.78 | 0.76 | 0.78 |
| nz1 | 0.55 | 0.79 | 0.72 | 0.56 | 0.78 | 0.76 | 0.78 |
| nz2 | 0.55 | 0.79 | 0.71 | 0.60 | 0.73 | 0.73 | 0.75 |
| abs50 | 0.55 | 0.89 | 0.85 | 0.85 | 0.91 | 0.92 | 0.91 |
| abs50' | 0.55 | 0.86 | 0.84 | 0.66 | 0.88 | 0.86 | 0.89 |
| abs50c | 0.55 | 0.88 | 0.84 | 0.78 | 0.91 | 0.88 | 0.91 |
Each column corresponds a statistical learning algorithm. "base" is the majority vote, a training set likely consists of more than 50% of +1. So the model says that the label of every text is +1. "RF" is the random forest and "KNN" is K-Nearest Neighbourhood. "wPLR" is a (penalised) logistic regression with (tuned) class_weights. "PLR" is the penalised logistic regression with a tuned probability threshold (and weight 1). "cos" is a so-called cosine-similarity predictor.
Each row corresponds a different feature choice. - all: that no feature is dropped. (ncol=992) - nz1: the features taking only 0 except 1 observation are dropped (ncol=321) - nz2: the features taking only 0 except 2 observations are dropped (ncol=149)
The basic idea of dropping features with "low frequency" is to avoid overfitting. Since the feature matrix is sparse, a feature taking only 0 except one observation could cause overfitting. This idea works more or less.
But it is better to make use of the preference vector. Let $\pi = (\pi^1,\cdots,\pi^{992})$ be the preference vector, that is, the signed sum of TFIDF vectors and the signs come from the label.
- abs50: pick the largest 50 values $|\pi^j|$ and use the corresponding features
- abs50': pick the largest 28 values and the smallest 22 values of $\pi^j$ and use the corresponding features. (The numbers 28 and 22 come form the rate of the labels in the training set.)
- abs50c: restrict the features to ones in the test set, then pick the largest 50 values $|\pi^j|$ and use the corresponding features. (c of abs50c means "cheat".)
There is no reasonable reason for choosing only 50 features except guarantee of the execution on the server.
What is happening
The key observation was: that the preference vector and the trained parameters of logistic regression are highly correlated. Therefore we can efficiently choose features for logistic regressions by looking at the preference vector.
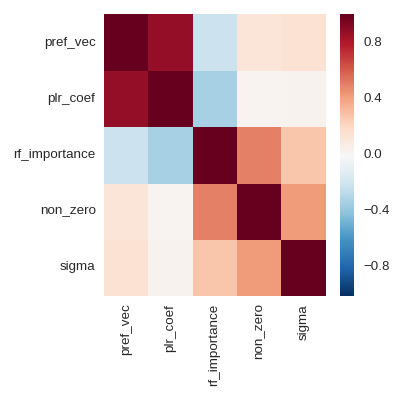
In the above heat map, "non_zero" is just a count of non-zero values in each column, and "sigma" is the standard deviation. I do not think that it is a good idea to look at variable importance in the random forest, because the feature matrix is sparse. A random shuffle of a column has no large effect.
Conclusion
- Compute the preference vector, then choose features whose absolute values in the vector are in the top 50.
- The large number of predictors do not mean a better predictive model.
I will implement the predictive model with the above feature selecting. It is natural to use only the cosine-similarity predictor for the recommender system. But my recommender system is a kind of experiment to look at the behaviour of predictive models.
Remark: The scores which I gave above will obviously change if I give a new label.